The Homelessness Monitor is a longitudinal study, commissioned and funded by Crisis, providing an independent analysis of the homelessness impacts of recent economic and policy developments in the United Kingdom. It considers both the consequences of the post-2007 economic and housing market recession, and the subsequent recovery, and also the impact of policy changes.
The first English monitor was released in 2011 and these pages document the change in homelessness trends since this baseline data was undertaken in England, Scotland, Wales and Northern Ireland. Statutory homelessness policy has diverged significantly across the UK since devolution in 1999 and is a contributing factor in explaining the variation in the levels and patterns of homelessness.
The research is carried out by Suzanne Fitzpatrick, Glen Bramley and Beth Watts-Cobbe at Heriot-Watt University, Steve Wilcox former professor at the University of York, and Hal Pawson at the University of New South Wales.
The following data is based on the latest published Homelessness Monitor in each country – England (2017), Wales (2015), Scotland (2015) and Northern Ireland (2016). For full research findings please download the monitor reports in the knowledge hub library.
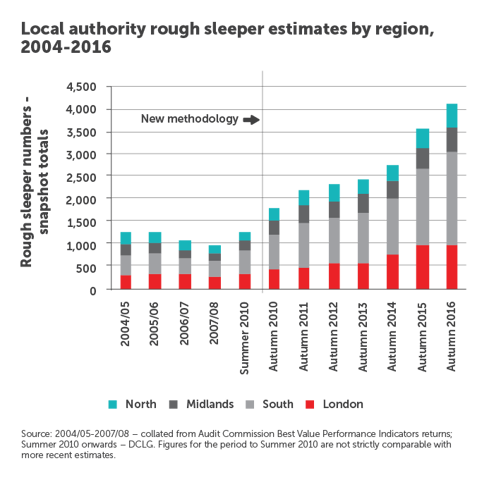
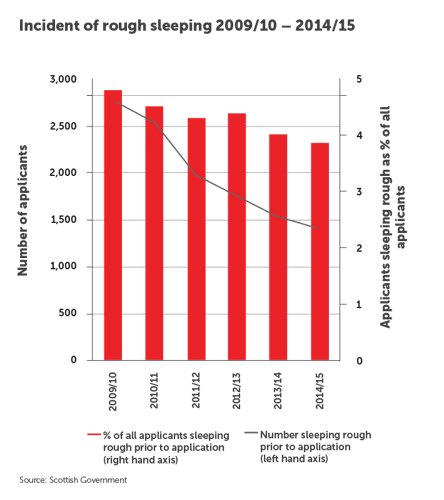
Rough sleeping levels
There are no regular street count data or other trend data published on rough sleeping in Northern Ireland. However, a recent 'street needs audit' indicates that rates of visible rough sleeping remain low in Belfast city centre, average six people per night.
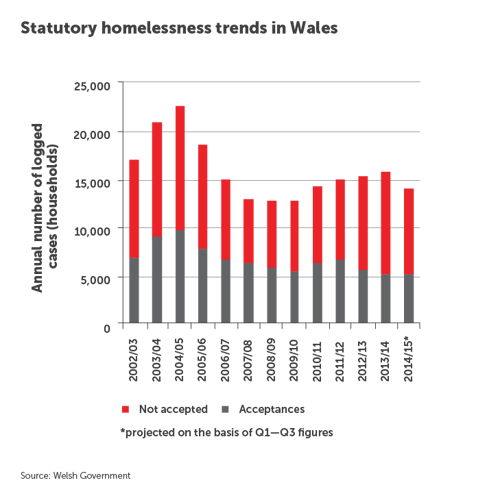
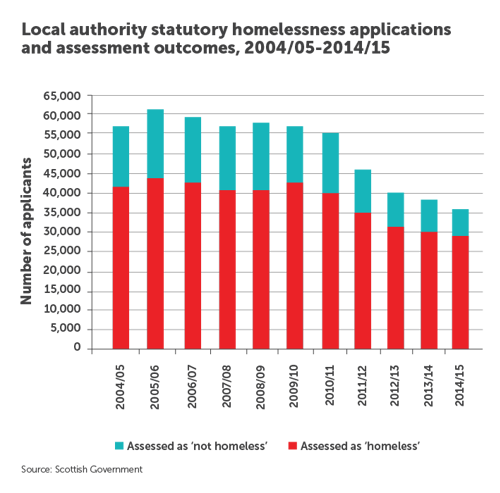
Statutory homelessness levels
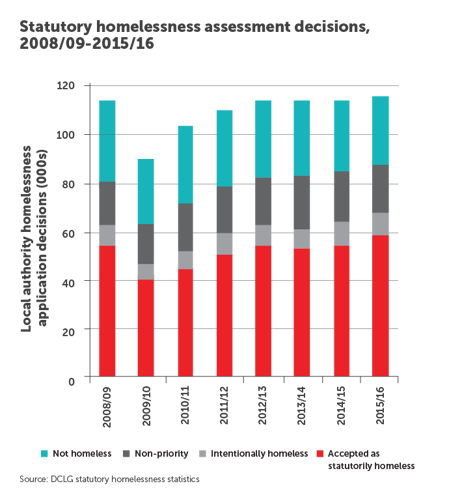
In 2015/16 18,600 households presented as homeless in Northern Ireland. Well over half of these at 11,200 were judged as ‘Full Duty Applicants’. Full duty applicants are those who have passed the four statutory tests – they are homeless, in priority need, eligible for assistance and unintentionally homeless.
The graph below shows that the number of homeless presentations have remained at fairly stable levels throughout the past decade but the number of households being given a ‘Full Duty’ has risen year on year since 2012/13. In contrast, the number of homelessness applications that did not attract Full Duty status.
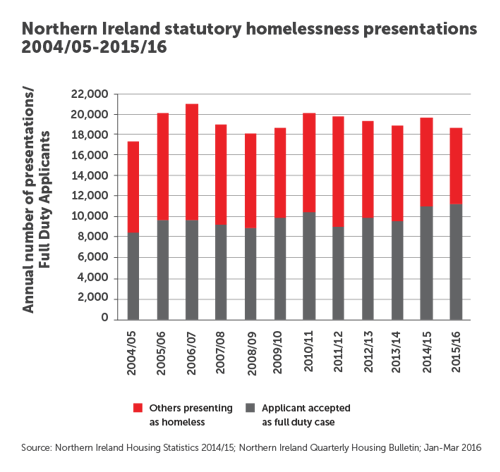
In contrast, the number of homelessness applications that did not attract Full Duty status have fallen sharply. This can be explained by changing local authority practices and the piloting of the Housing Solutions model which focus on informal actions to prevent homelessness.
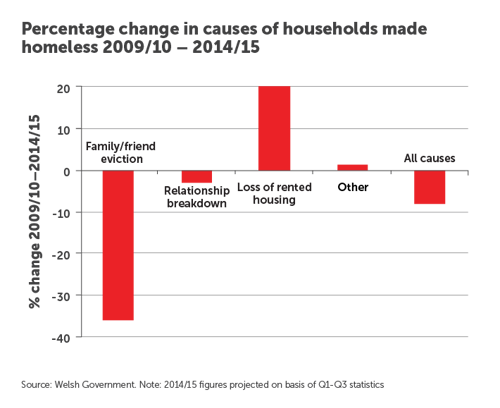
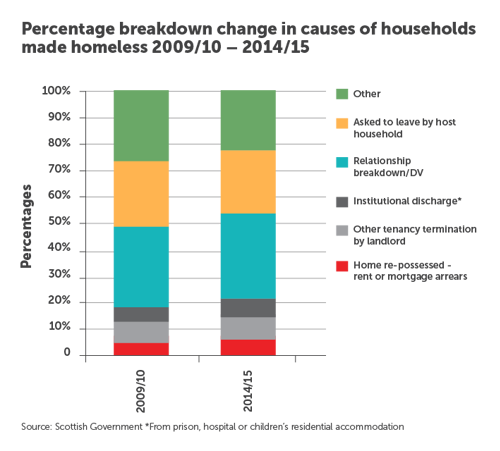
Causes of homelessness
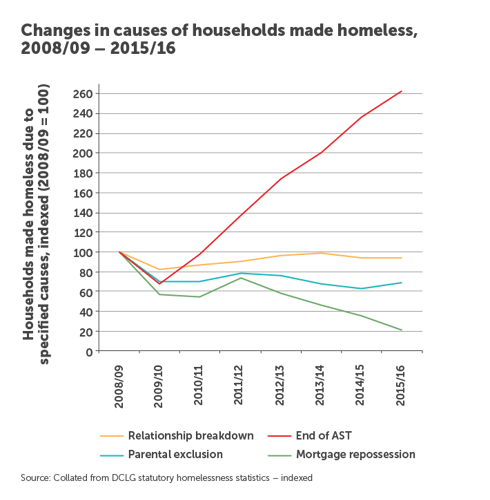
The chart below shows the ‘reason for homelessness’ among those applicants with a Full Duty. These categories are unique to Northern Ireland making comparisons with the rest of the UK limited. An important difference is the ‘accommodation not reasonable’ which includes older people subject to rehousing having been judged to no longer be able to manage a family home.
If this group are discounted from overall ‘Full Duty’ statistics the growth in homeless approaches would be halved to 6%. An important difference is the ‘accommodation not reasonable’ which includes older people subject to rehousing having been judged to no longer be able to manage a family home. If this group are discounted from overall ‘Full Duty’ statistics the growth in homeless approaches would be halved to 6%.

A rise of 12% for ‘loss of rented accommodation’ in the last three years is modest in comparison to 250% rise over the last five years in England, which is likely to reflect the milder impact of the Local Housing Regime in Northern Ireland.
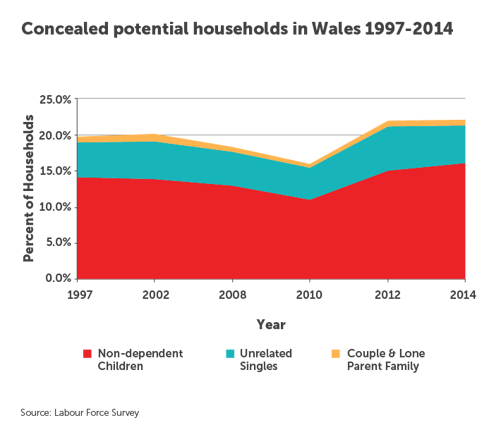
Hidden homelessness
Hidden homelessness refers to people who are considered homeless but whose situation is not visible either on the streets or in official statistics. This includes sofa surfers and people involuntarily sharing with others on a long term basis. Using household surveys, it is possible to build a picture of hidden homelessness in terms of concealed households, those sharing accommodation and overcrowded households.
Using household surveys, it is possible to build a picture of hidden homelessness in terms of concealed households, those sharing accommodation and overcrowded households.
There has been a small overall fall in the number of concealed potential households since 2010. There are an estimated 76,000 to 136,000 adults currently living as concealed households in Northern Ireland who would prefer to live independently. After a long history of decline shared accommodation has increased markedly in Northern Ireland, accounting for 4.4% of all households in 2015.
After a long history of decline shared accommodation has increased markedly in Northern Ireland, accounting for 4.4% of all households in 2015.
Northern Irish economic growth
In the seven years since the credit crunch the Northern Irish economy has recovered much more slowly than in the rest of the UK, as illustrated in the graph below. Unemployment and economic inactivity among the working age population are notably higher in Northern Ireland at 32% compared to the rest of the UK at 27%.
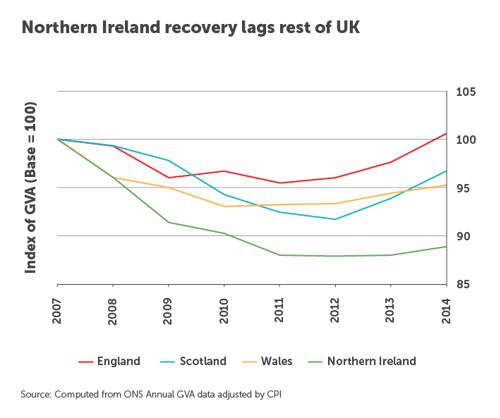
Public sector jobs account for a much higher proportion of total employment then in the UK making workers particularly vulnerable to public expenditure cuts. Northern Ireland is also characterised by low levels of pay, and household incomes, compared to the rest of the UK with average fulltime earnings 17% lower than in the rest of the UK.
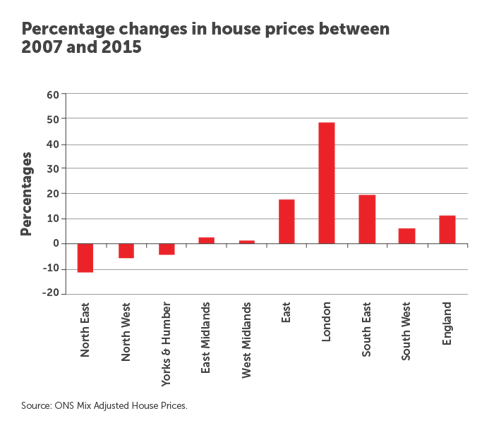
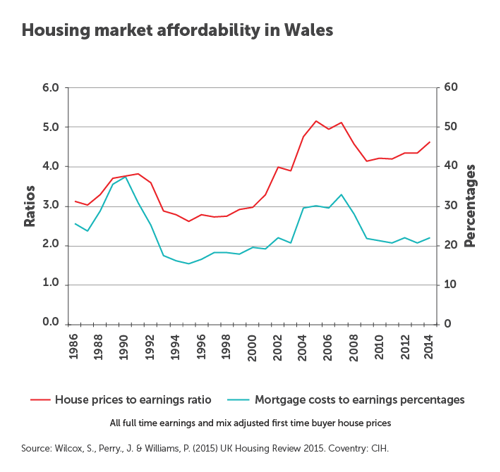
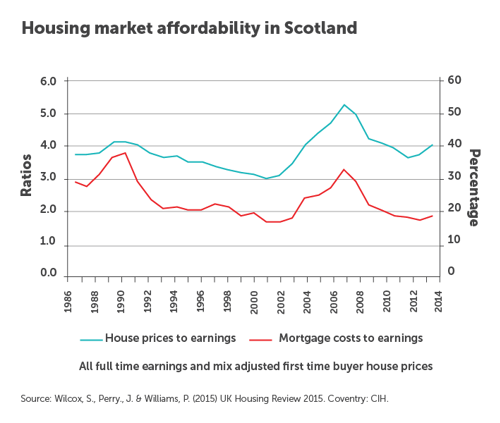
Housing market affordability
The Northern Irish housing market has over the last two decades followed a distinctive pathway compared to the rest of the UK. It is more closely linked to the Irish economy and housing market. As the graph shows in
As the graph shows in 2007 the market went from one of the most affordable in the UK to being one of the least and briefly was even less affordable than London. As in Ireland, the subsequent fall in house prices was also far more severe than the across the rest of the UK. This has returned the market to more traditional levels leaving behind
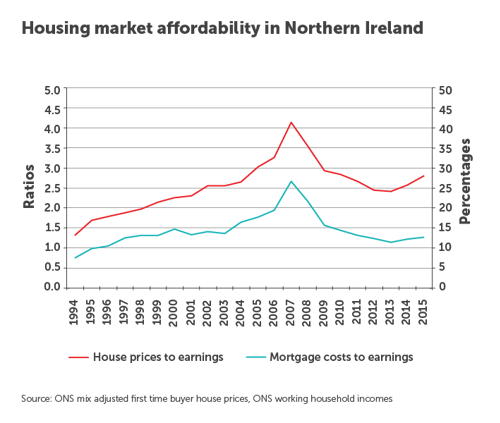
This has returned the market to more traditional levels leaving behind higher proportion of households in negative equity.
Access to home ownership has become more problematic for first time buyers, as the reduced flow of mortgage funds and regulatory pressures have drastically reduced the availability of mortgage products for those with low or no deposits.
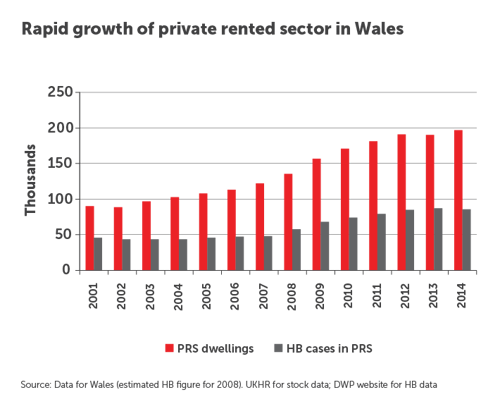
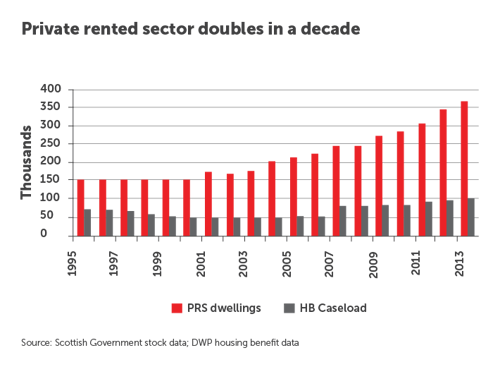
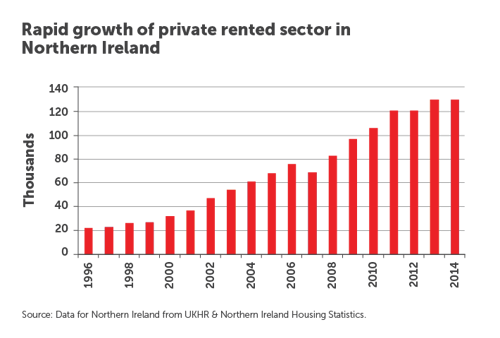
Private rented sector
The private rented sector has almost quadrupled in Northern Ireland over the last fourteen years. It has grown from 32,000 dwellings in 2000 to 103,000 in 2014. This is proportionally far higher than in the rest of the UK.
This market fulfills an important and active role in providing accommodation for households at all income levels and is consequently providing accommodation for a high proportion of all households moving in each year.
Unlike England, there has been no pronounced recent rise in the number of homeless applicants due to the loss of rented accommodation. This is likely to reflect the different impacts of welfare reform.
Social housing lettings
Northern Ireland devotes a higher proportion of its public expenditure to housing relative to the rest of the UK. Despite this Northern Ireland does not have a higher proportion of social housing when compared to the rest of the UK, as the graph below shows.

The proportion of social sector letting as part of overall housing tenure in Northern Ireland is 16% which is similar to England at 17%, whilst Scotland has the most at 24%. As in the rest of the UK new social housing is now being provided by housing associations. Yet housing associations only account for just over a quarter of the sector in Northern Ireland.
Welfare policies
The Northern Ireland Executive has is due to introduce, most of the welfare reforms now underway in Great Britain, but with some notable exceptions or modifications. An agreement was reached with the UK government to provide a funding package to enable Northern Ireland to mitigate those welfare reforms based on the recommendations of a Working Party chaired by Professor Eileen Evason. As a result both the ‘Spare Room Subsidy Limits’ and the Benefit Cap will be fully mitigated until 2020.
Reforms to the Local Housing Allowance regime in Northern Ireland were introduced on the same basis, and to the same timetable, as for the rest of the UK. There is little hard evidence on their impact, and while lower rents in Northern Ireland mean that the effects are unlikely to have been as substantial as in England, a growing gap between Local Housing Allowance rates and average rents may compound these impacts over time.